
Sample analyses
See what an analysis can deliver
These demonstration projects show the shape of a finished analysis. They use public or schematic data, are clearly labelled as demonstrations, and are not presented as client work.
What each example includes
Every sample analysis is written up against the same structure, so you can see how an engagement is scoped, run, and reported.
- Research question
- The biological question the analysis was set up to address.
- Inputs
- Data type, sample count, groups, and platform where relevant.
- Methods and software
- The approach, key tools, and parameters actually used.
- Quality checks
- The checks performed before results were interpreted.
- Main result
- A supported finding, stated without overclaiming.
- Limitations
- The important caveats that affect interpretation.
Gallery
Demonstration analyses
Browse the kinds of analyses we run across sequence data, microbial communities, structure, gene expression, and statistics. Each item is a clearly labelled demonstration, not client work.
-
 Demonstration
Workflow
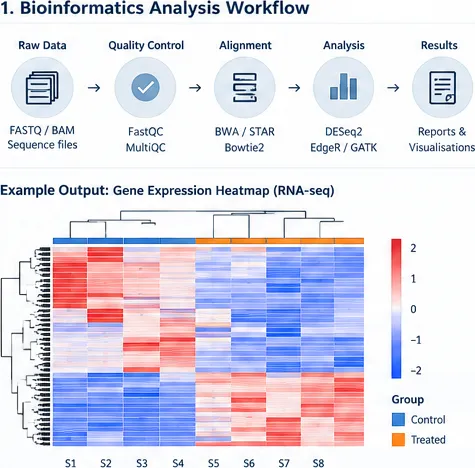
Bioinformatics analysis workflow
A schematic overview of a typical analysis pipeline, from raw data and quality control through to figures and a written interpretation.
-
 Demonstration
Genomics
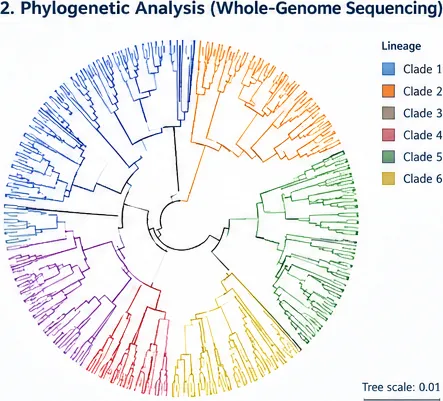
Phylogenetic analysis (whole-genome)
Whole-genome phylogeny showing relationships among sequenced isolates, with the alignment, model, and support values reported alongside the tree.
-
 Demonstration
Microbiome
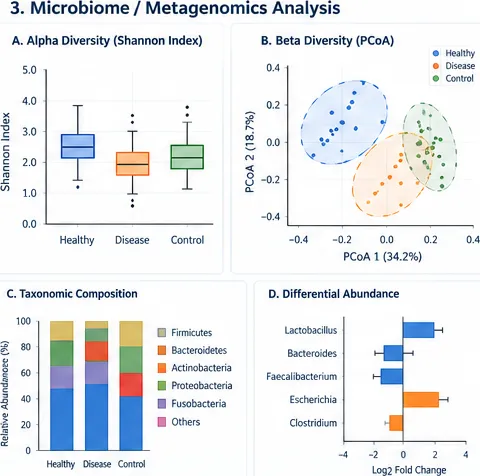
Microbiome / metagenomics analysis
Community composition and diversity summaries from metagenomic data, with group comparisons tested rather than read off a plot.
-
 Demonstration
Structural bioinformatics
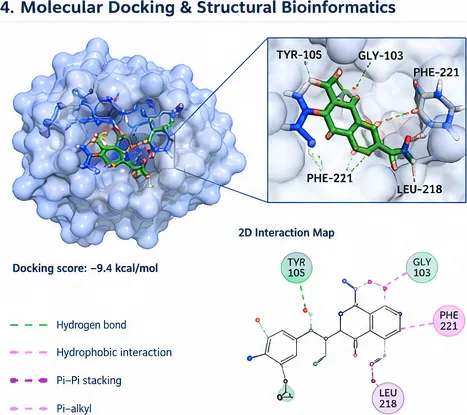
Molecular docking & structure analysis
A docking and protein-ligand interaction example. Poses and scores are computational estimates and do not by themselves prove binding.
-
 Demonstration
Gene expression
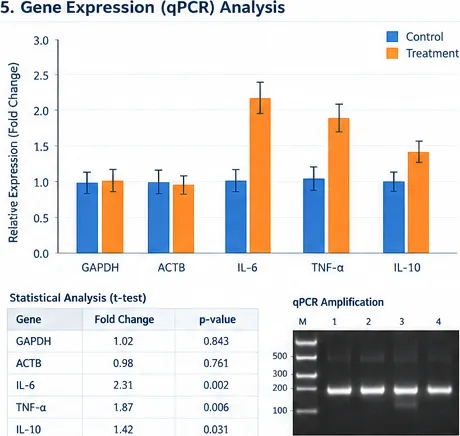
Gene expression (qPCR) analysis
Relative expression across experimental groups, showing the comparison, reference genes, and the assumptions behind the calculation.
-
 Demonstration
Statistics & figures
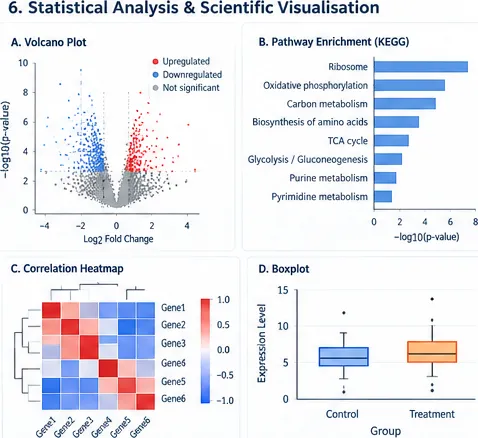
Statistical analysis & visualisation
Statistical testing paired with publication-style figures, presented with the method used and the limits of what the data can support.
Every figure is illustrative. For a real project, the exact deliverables are agreed in writing before work starts.
Have a similar dataset?
Tell us about your project and we will outline how an analysis would be scoped, what the deliverables would be, and where the limitations are.